Interaction between raster and vector data cubes facilitates the spatio-temporal analysis and monitoring of landforms


1 Department of Geoinformatics - Z_GIS, University of Salzburg, 5020 Salzburg, Austria
Landscapes and landforms are in constant change with dynamic processes driving their evolution. Monitoring landforms related to natural hazards, like proglacial lakes, volcanic lava flows, landslides or gully erosion, is important for disaster risk prevention and mitigation. There, Earth observation (EO) data and data cubes have shown useful to study landscape dynamics.
Objectives: 1) to adapt vector data cubes to structure and analyse landforms with changing geometries and 2) to adjust spatio-temporal operations for raster-vector data cube interaction.
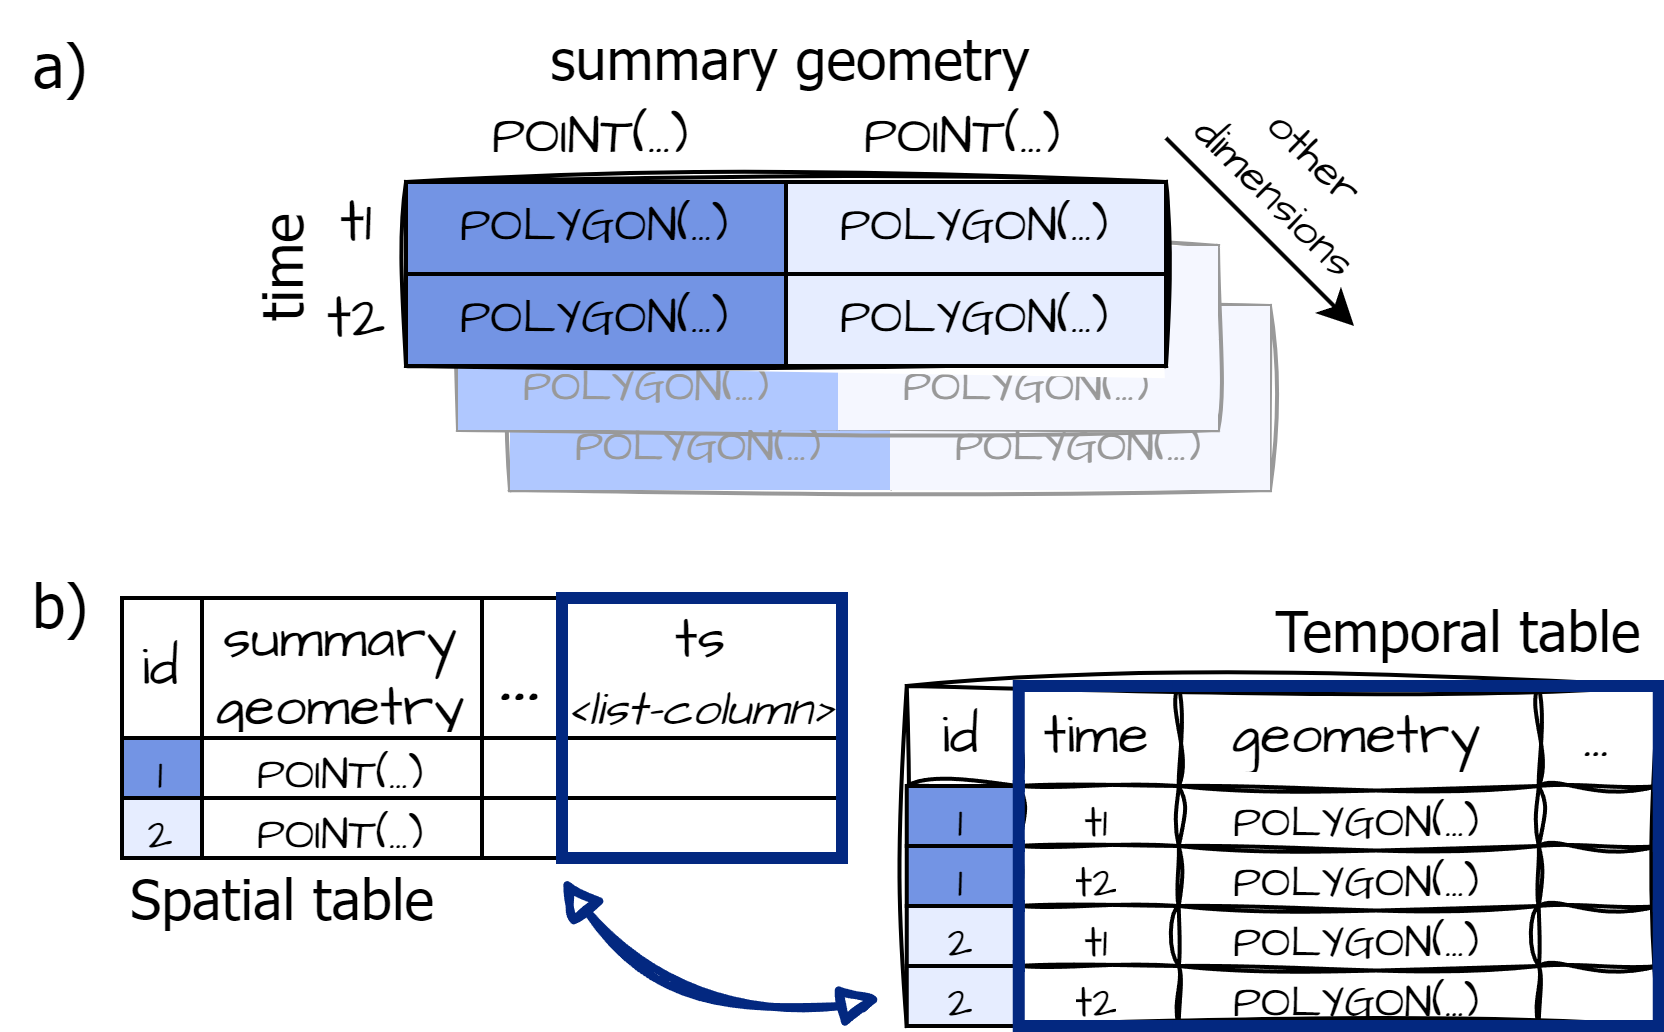
Figure 1: Array-based (a) and tabular (b) representations for vector data cubes
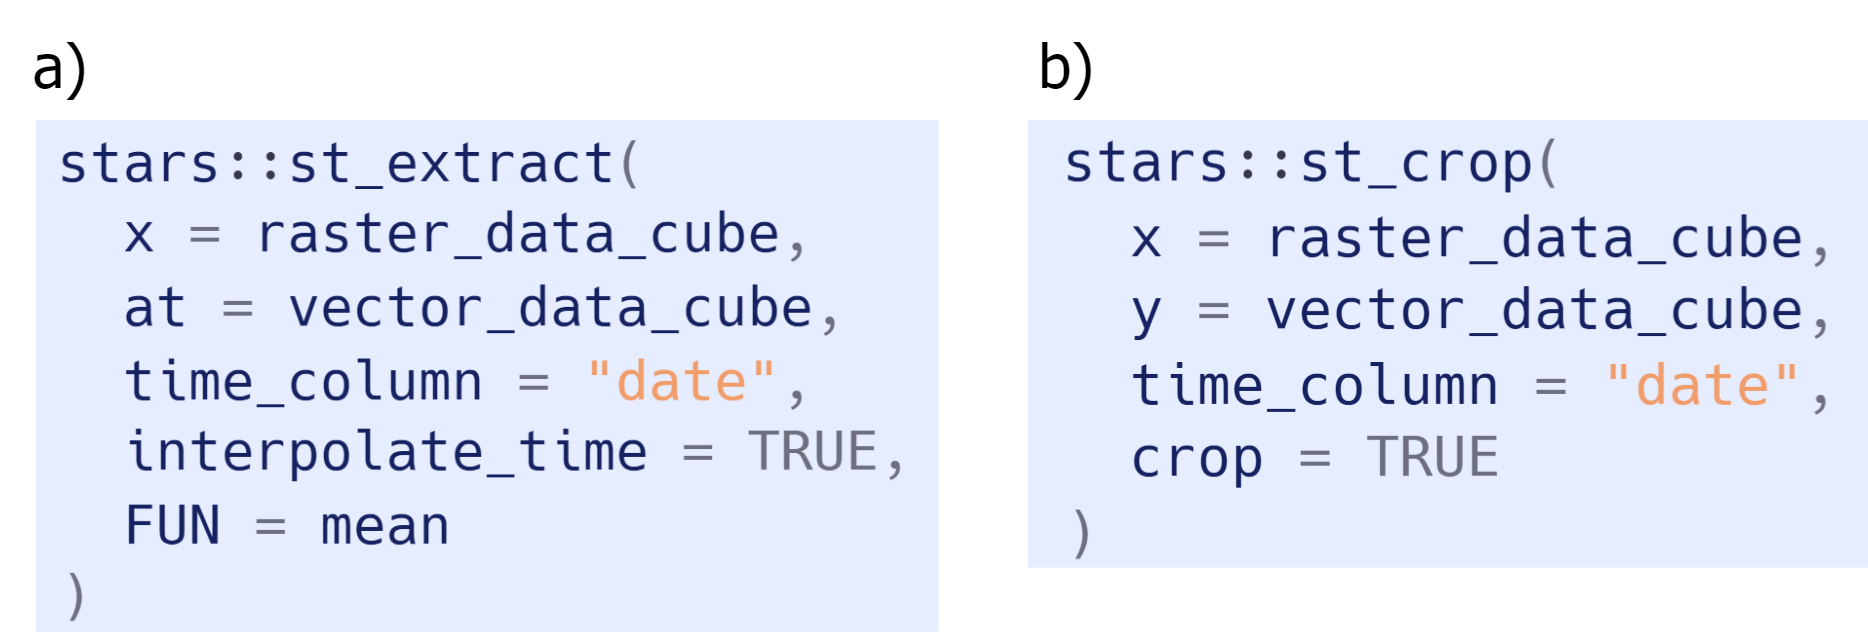
Figure 2: Spatio-temporal operations with the R package {stars}.
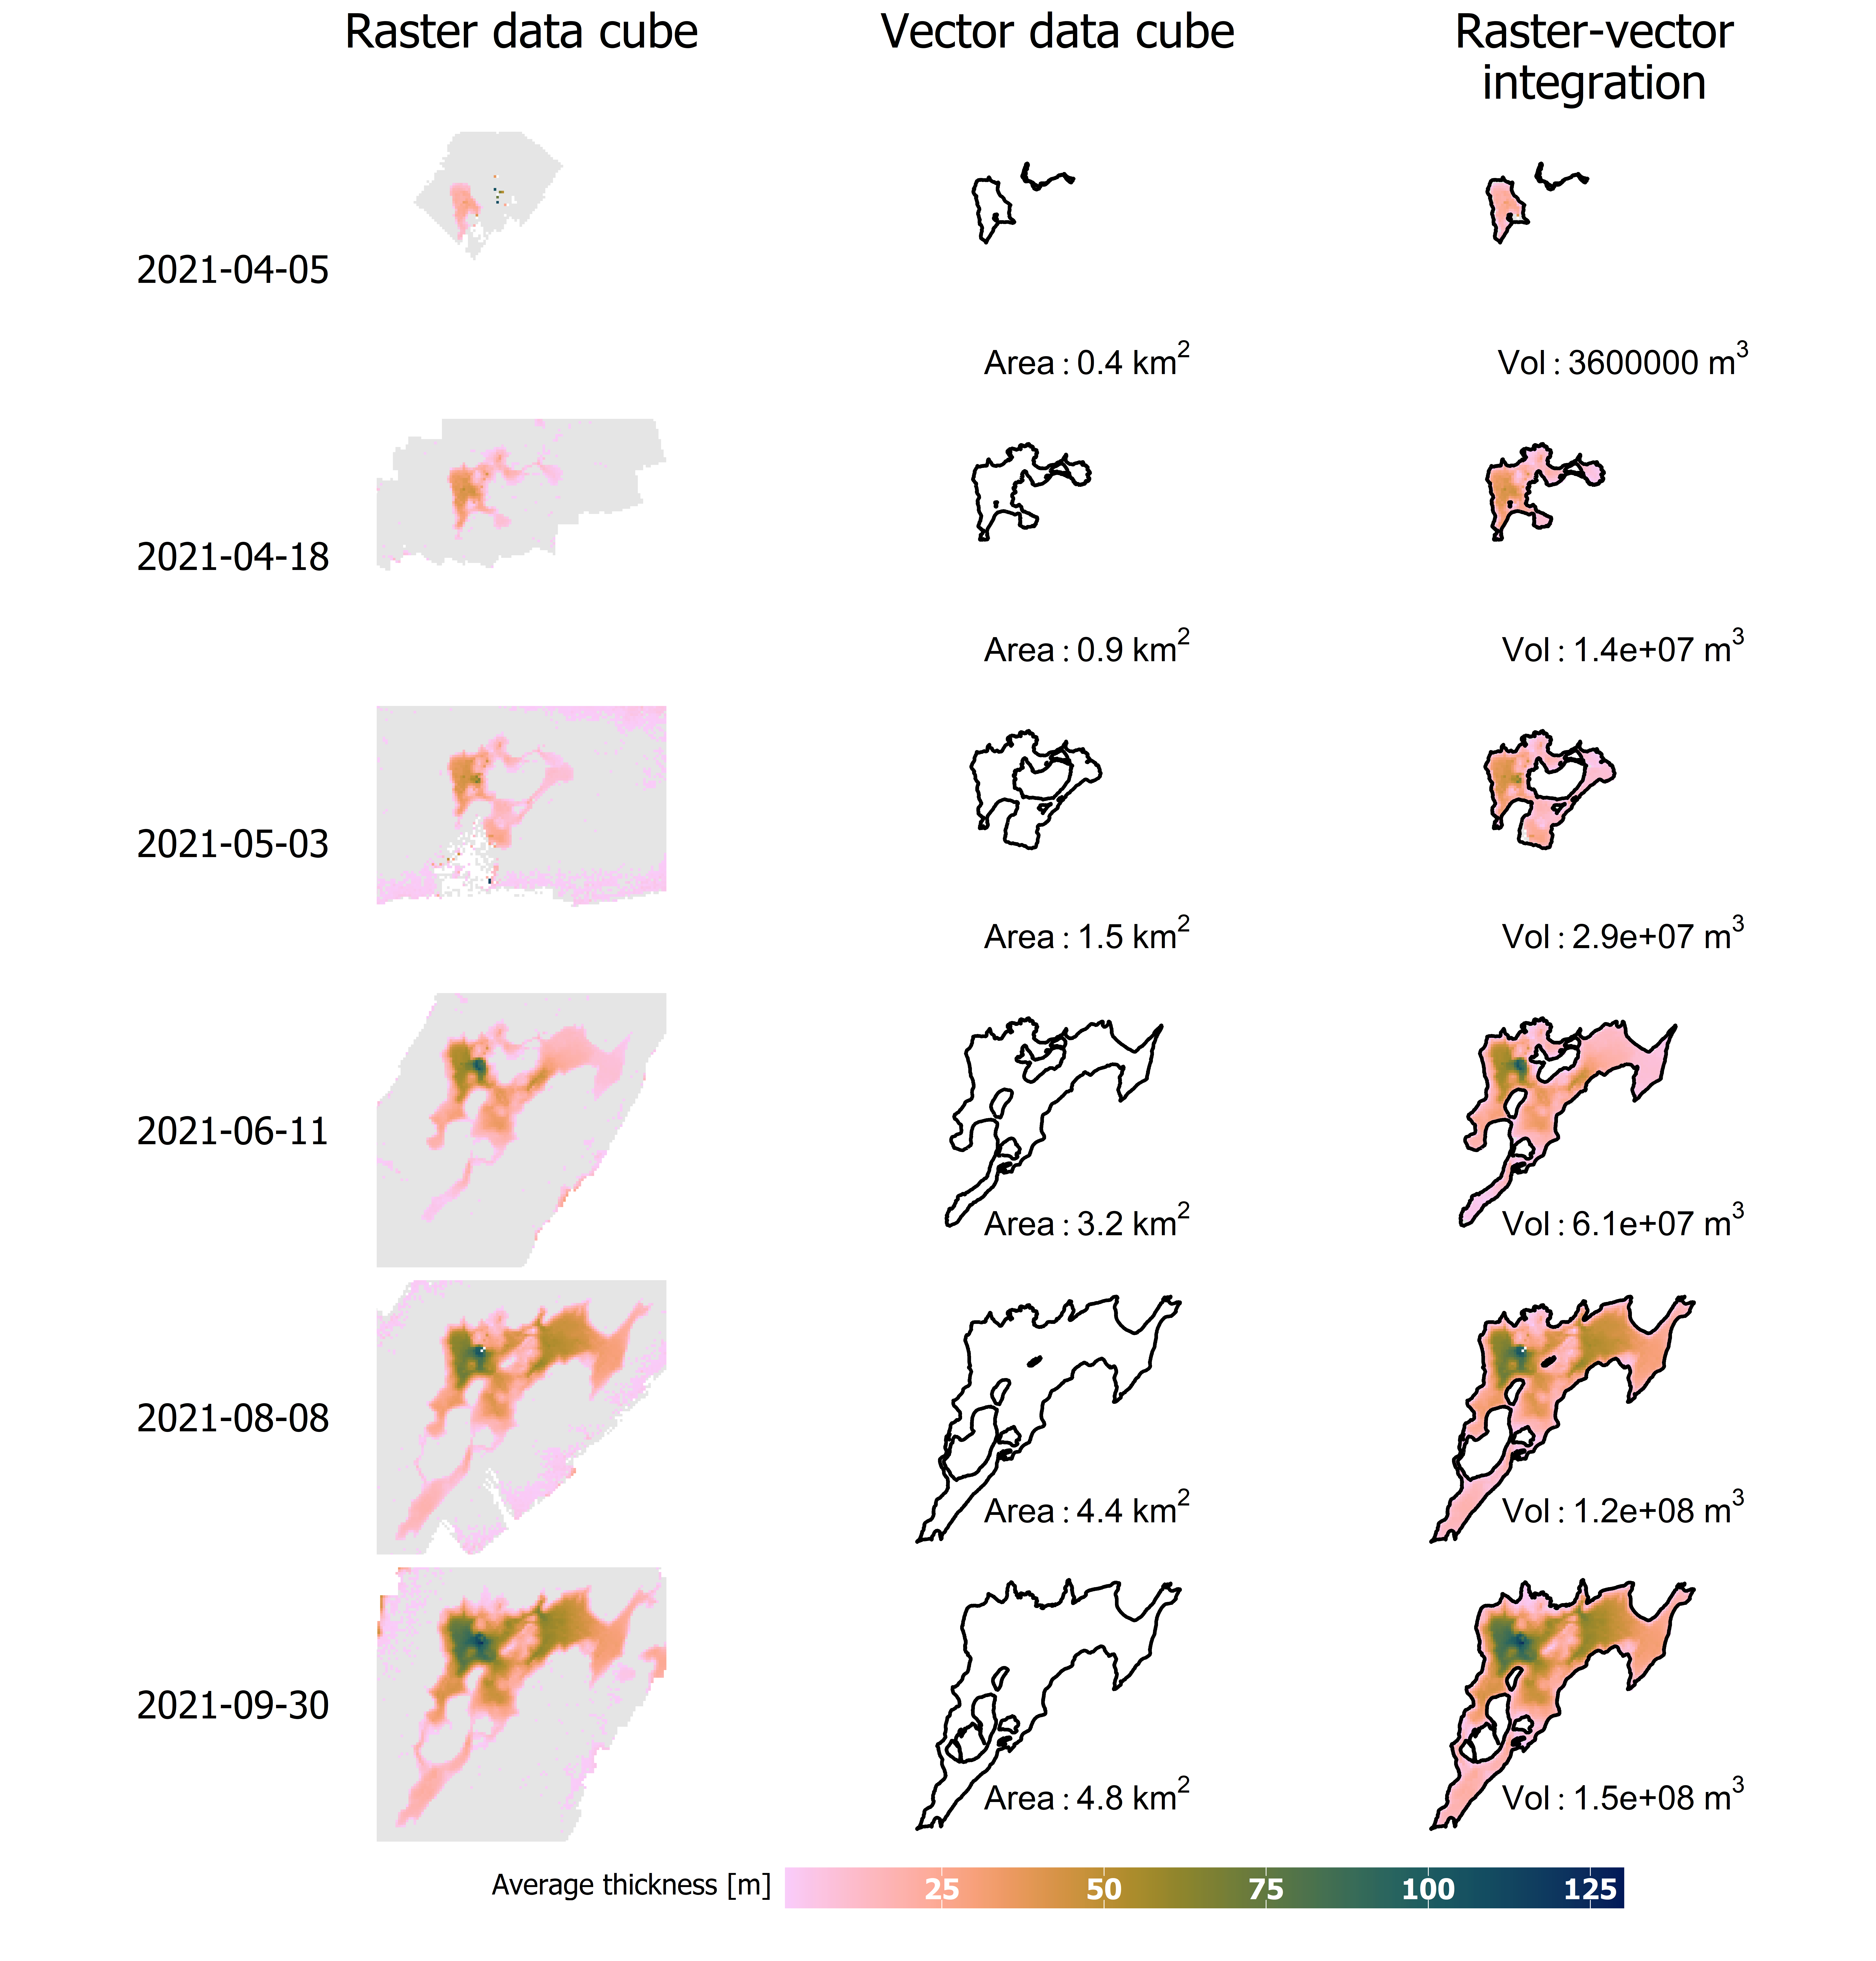
Vector data cubes and their integration with raster data cubes are showcased with the Fagradalsfjall volcanic lava flow outlines from Pedersen et al. (2023). The centre figure shows a subset of lava flow outlines and elevation rasters from the study. The raster/vector integration allows extraction of zonal statistics (Fig. 3) but also spatial cropping considering the temporal dimension.
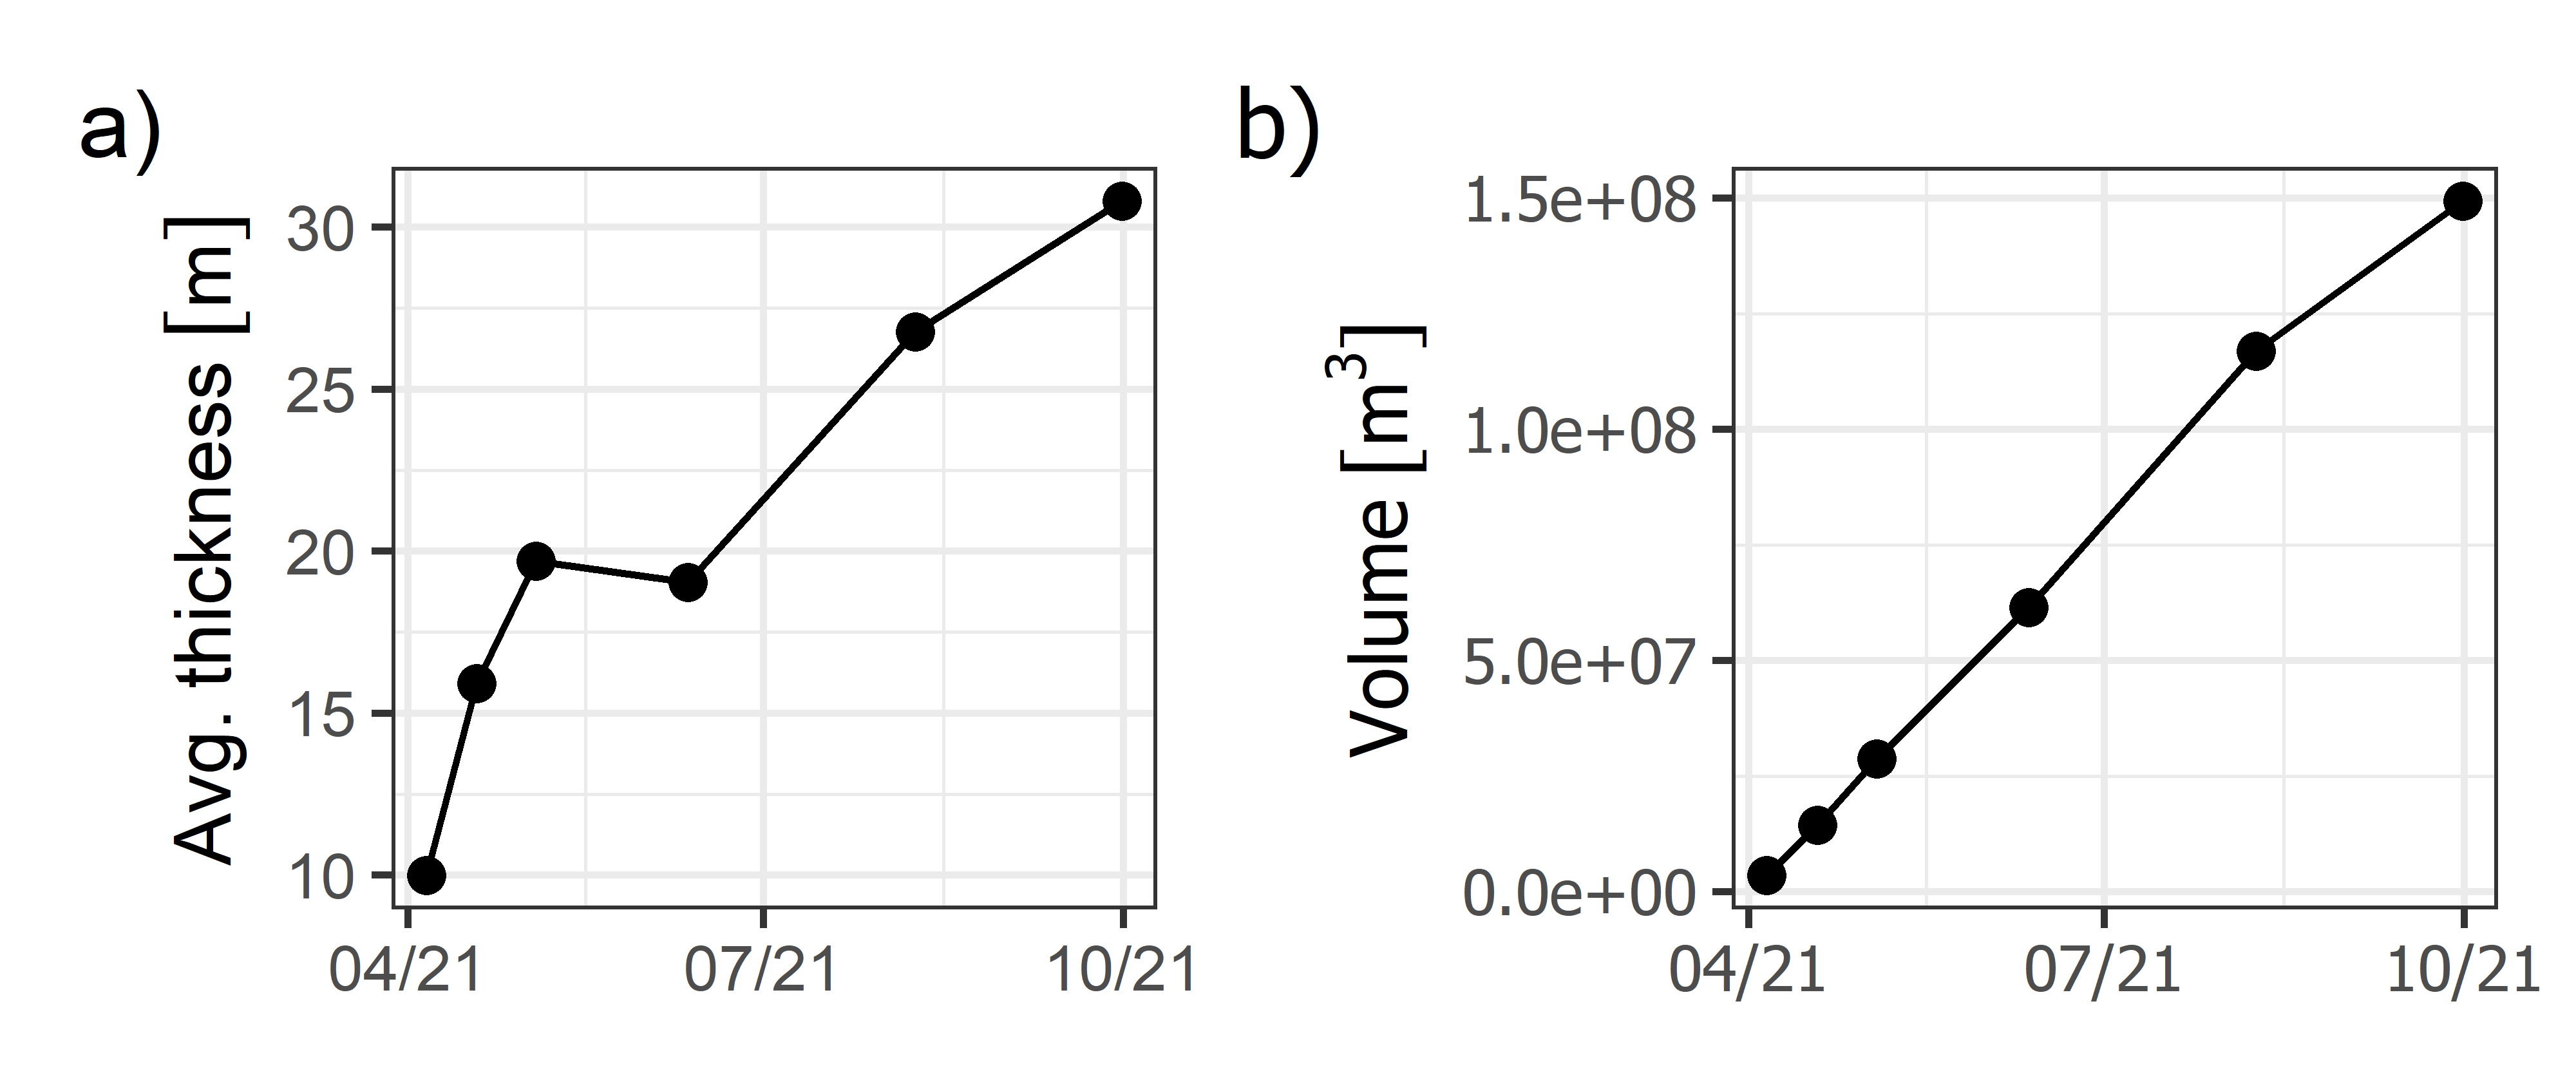
Figure 3: Time series of average thickness (a) and volume (b) of lava flows in Fagradalsfjall, Iceland.
Vector data cubes for features with changing geometries facilitates landform characterisation. Further, the integration of spatial and temporal properties in data cube operations can benefit various disciplines within the geosciences.
Interaction between raster and vector data cubes facilitates the spatio-temporal analysis and monitoring of landforms


