6 Quarto dashboards
In this session you should learn:
6.1 What is a dashboard?
A dashboard is a user interface that allows interaction with the content displayed. This goes beyond making a plot zoomable and have a tooltip, but it usually let’s the user customise views and change parameters to get different insights. Static dashboards provide a fixed view of data without frequent updates, while dynamic dashboards are updated frequently and allow more interaction.
From a visualisation perspective, dashboards allow for further interactions with the data than what the creator of a static plot could have determined to show. It is very common to have such dashboard-like displays of spatial data, think for example of Google Earth Engine custom applications or ArcGIS dashboards and story-maps.
6.1.1 When should I use Shiny?
R has several tools for dashboard creation, with the most famous being Shiny. Then you might be wondering why this lesson is not about Shiny apps but rather about Quarto dashboards. Two reasons:
Quarto dashboards are fairly new, so even though they might not have the popularity of Shiny, they are getting used more and more.
Quarto dashboards are much easier to create and learn than using Shiny.
This by no means is to be interpret as a “don’t use Shiny”. Actually, the contrary. The more customisation you want to give to your dashboard and tools, the more you will be needing what Shiny apps offers. You can include Shiny inside your Quarto dashboards as a matter of fact.
| Criteria | Quarto dashboards | Quarto + Shiny |
|---|---|---|
| Aim | Layout & organisation, limited interactivity | Reactivity & interactivity1 |
| Hosting | Runs without a server | Needs a server (e.g. Shinyapps.io)2 |
| Performance | Fast (pre-rendered) | Slower (dynamic computation) |
| Updates | Needs re-rendering | Real time data updates possible |
| Audience | Passive viewers | Active users |
If you decide to use Shiny in your Quarto dashboard project and have problems with deploying with the server, write all the problems you encountered down. The Quarto + Shiny dashboard should still be able to built locally!
6.2 Dashboard basics
Your main guide to build a Quarto dashboard will be (surprise, surprise) the Quarto dashboard documentation. See the further reading section for more resources.
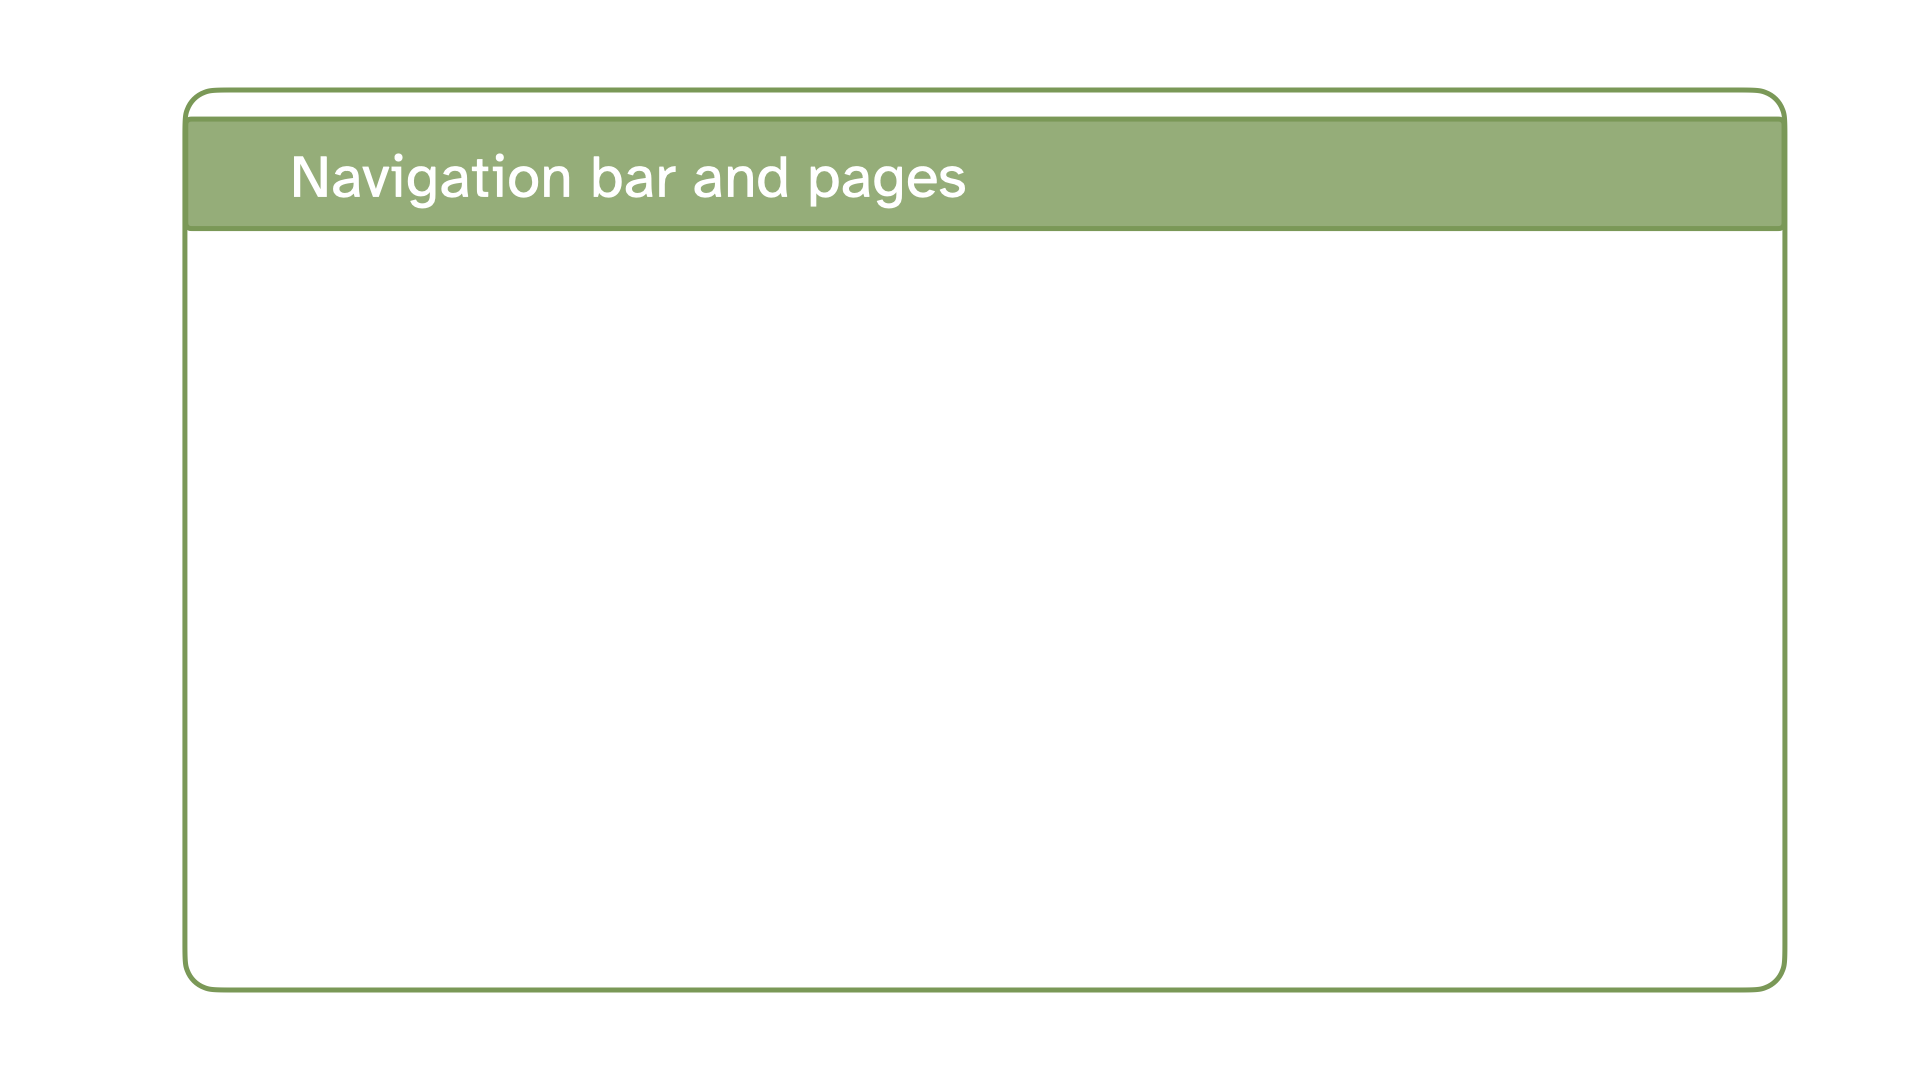
| Navigation bar | provides navigation between pages |
| Pages | useful to divide data for more complex stories |
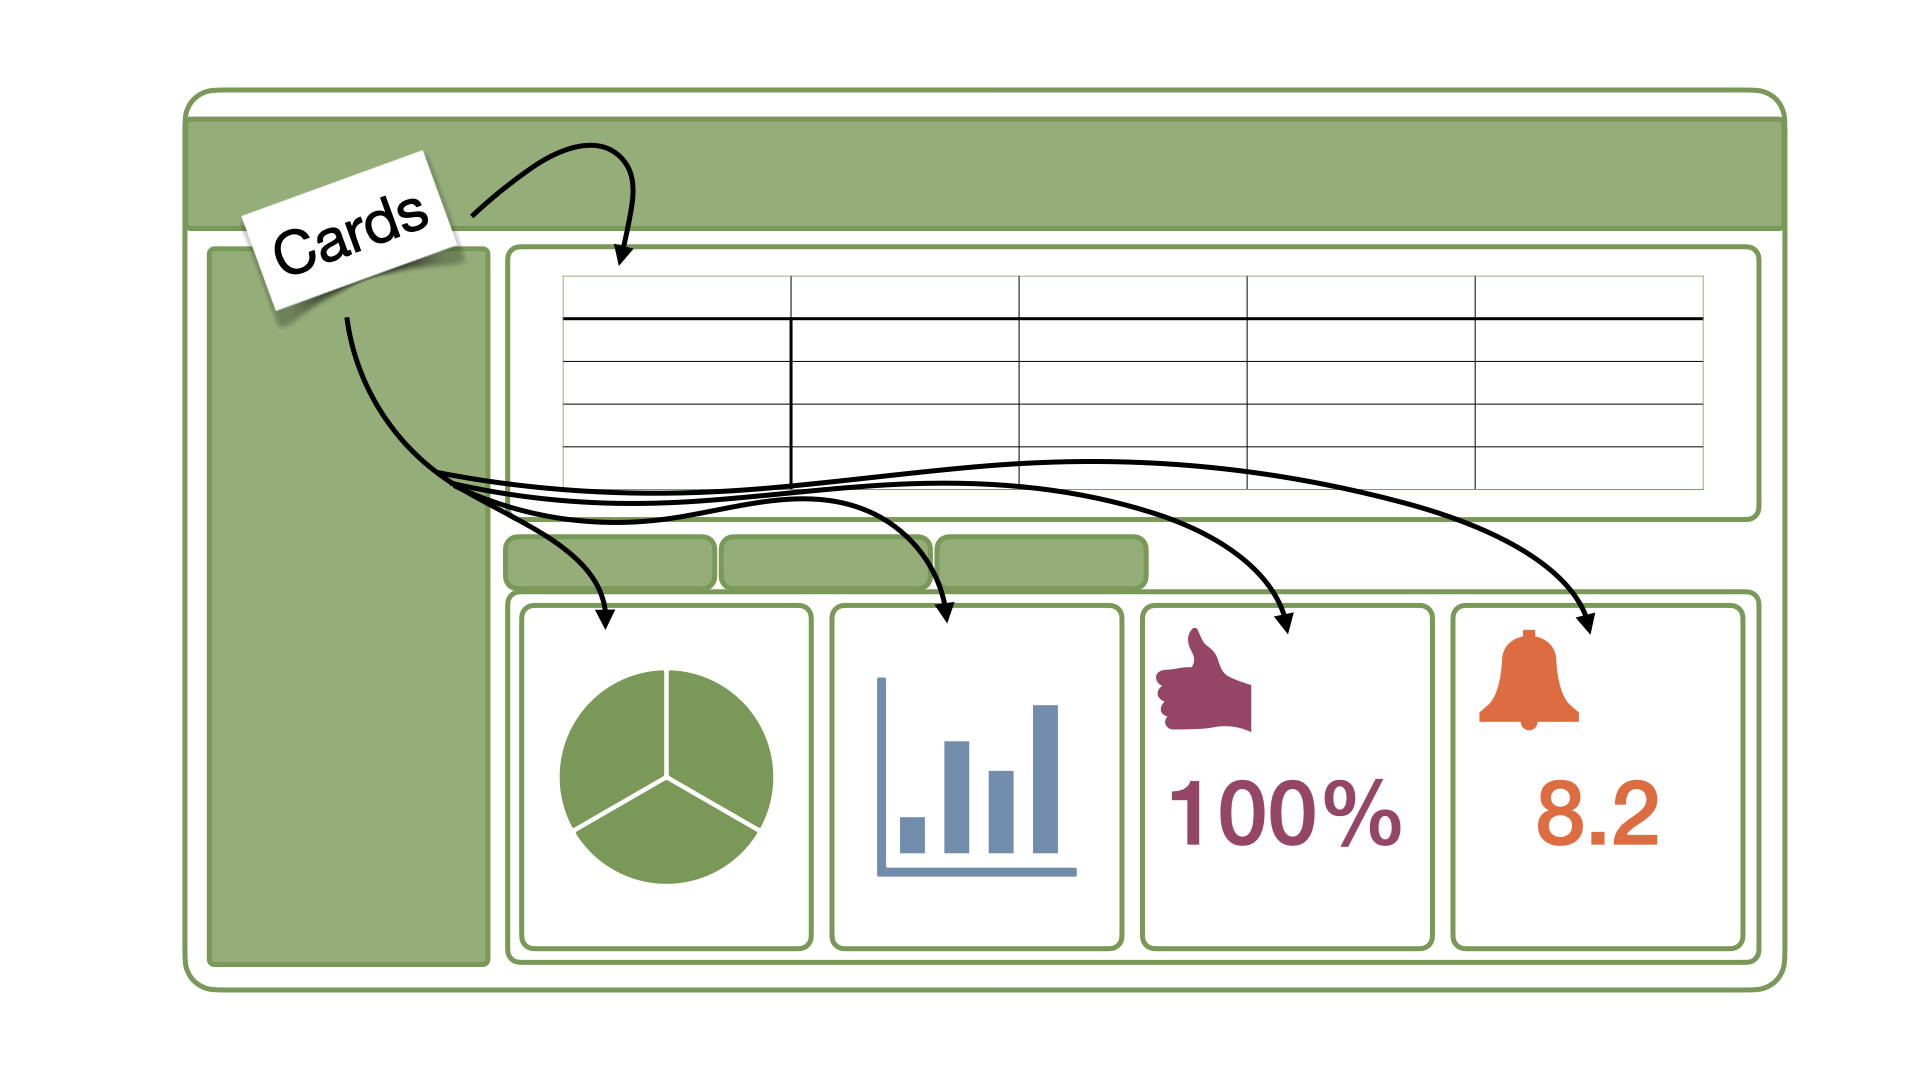
| Cards | fundamental unit of quarto dashboards, containers of all data elements; cards correspond to code chunks that return an output |
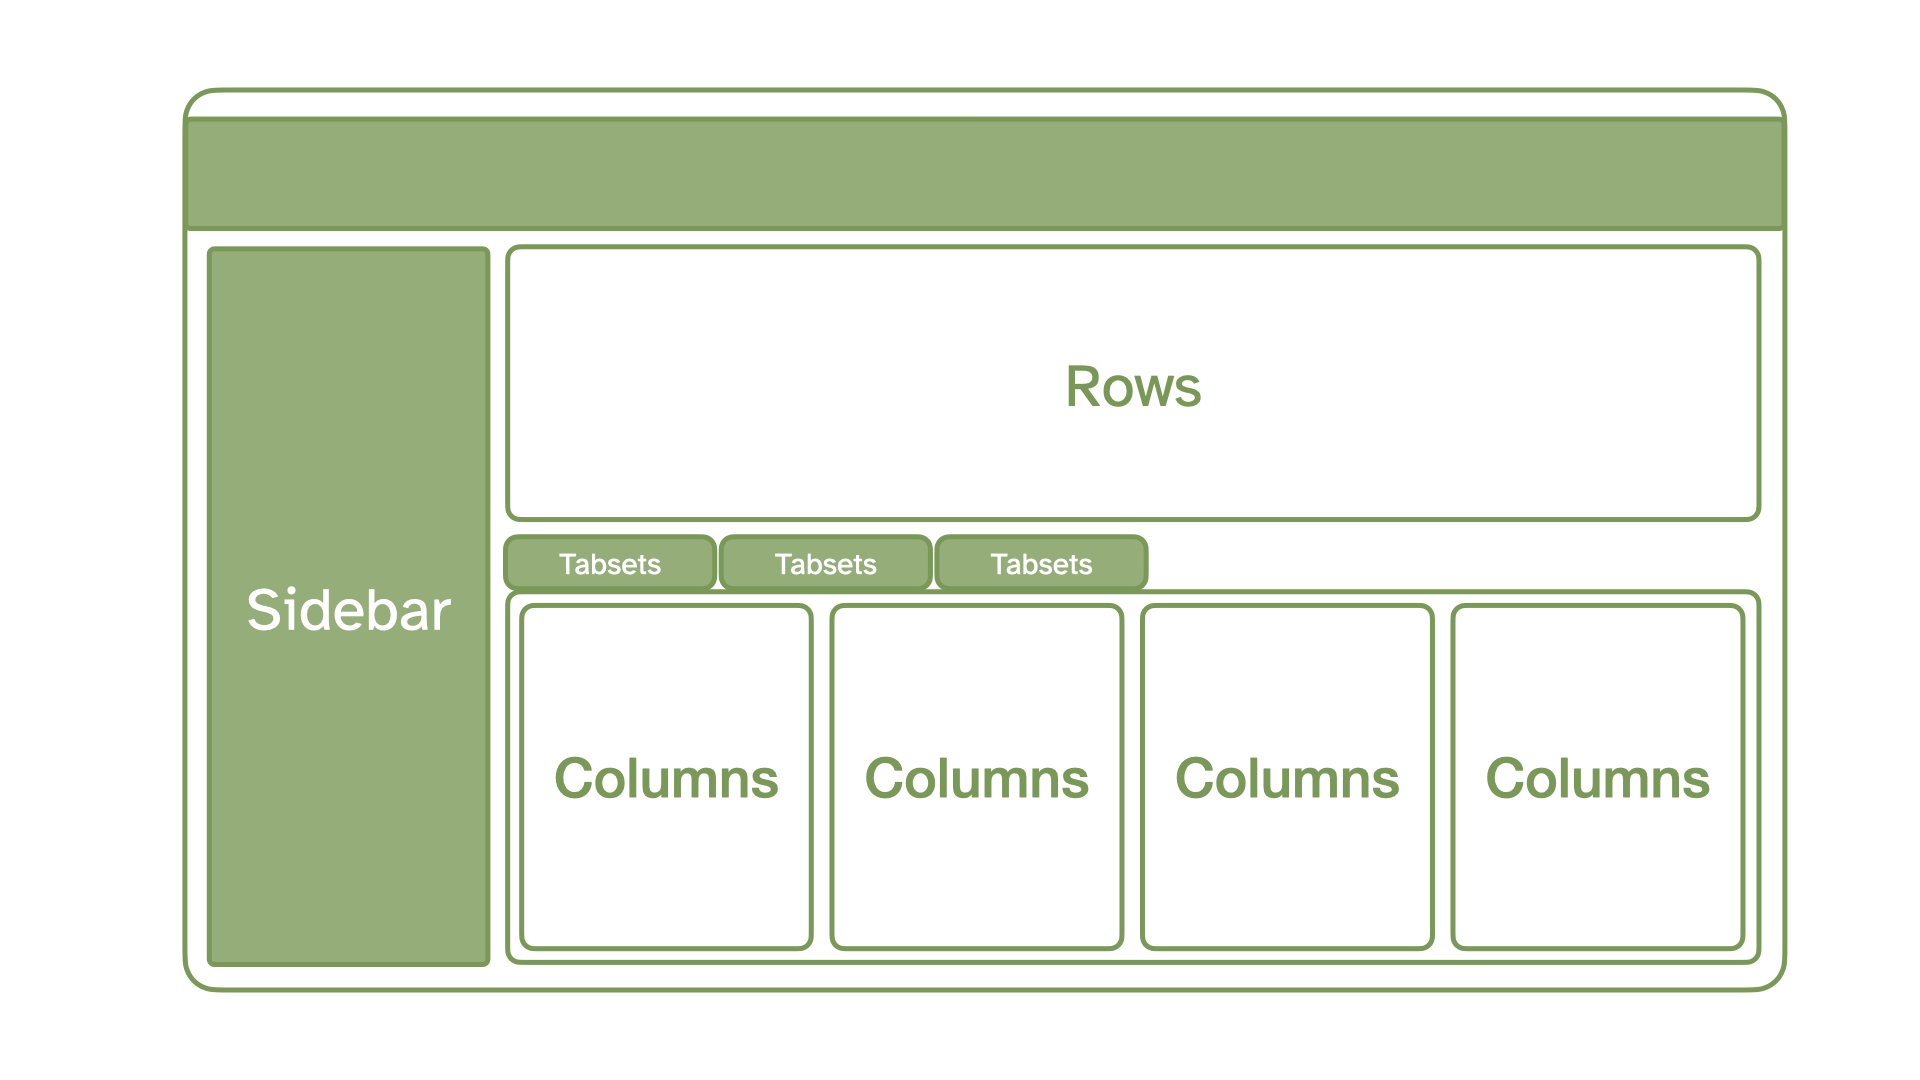
| Rows/columns | define where each card is placed in the dashboard |
| Tabsets | groups of rows and columns to further divide content |
| Sidebars | collapsible vertical panels for inputs; used for filters, tick boxes, etc. |
| Toolbars | horizontal panels for inputs; used for filters, tick boxes, etc. |
6.3 Packages for interactivity
Most of the packages that allow interactivity in R are based on JavaScript. This interaction is enabled in R due to the htmlwidgets tools. You will find some of the packages based on this tool under its documentation.
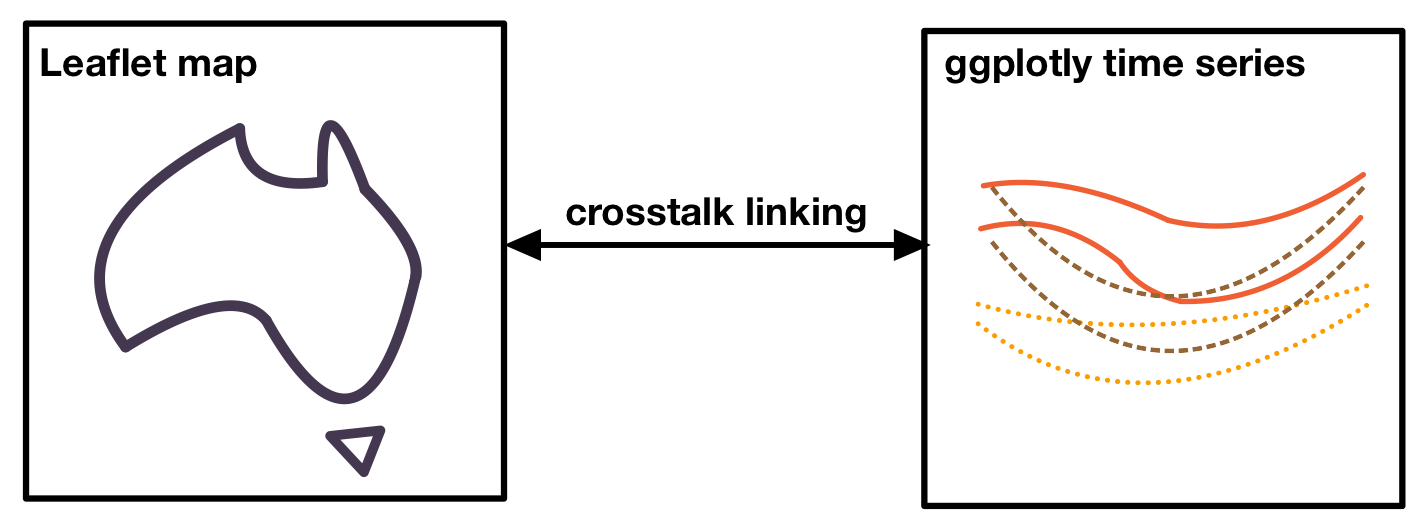
You can also link this widgets with packages such as {crosstalk}. Not every widget is “crosstalk-enabled” but maybe more and more will be available in the future.
Here you have a non-exhaustive overview of some of the packages that you might find most useful.
6.4 Dashboard example
6.5 Publish your dashboard!
The easiest way (at least for me) to publish any HTML content you create with Quarto is via GitHub pages. A free account let’s you create a website from a public repository in a very easy way.
6.5.1 Requirements
Get a Github account
Configure git on your computer - see the steps here.
Set up HTTPS or SSH protocols - see here - sections 9 to 11
6.5.2 Step by step guide
Step 1: Create a new GitHub repository
Go to your GitHub account > Repositories > New
Give it a name and a description and click “Create repository”
Step 1: Prepare Your Quarto Project
- Open RStudio and create a new Quarto project:
- Go to File > New Project > Version Control > Git.
- Go back to your GitHub repository and copy the “https://…” displayed under Quick setup
- Add content to your dashboard:
- Create an empty
index.qmdfile (or create additional.qmdfiles). - Include your visualisations, tables, text, etc.
- When you have one single html file to show, then it is useful to call it index since this will be automatically be recognised as the landing page of your site.
- If you have more complex websites (created e.g. with a Quarto website project), then the
.qmdfiles are mostly organised inside a_quarto.yamlfile. See more information on Quarto websites here.
- Create an empty
Step 3: Render Your Quarto Dashboard
- Render the project to generate the
.htmlfile with Render
Step 4: Push Your Project to GitHub
Commit and push the project to GitHub:
git add .
git commit -m "Initial commit"
git branch -M main
git push origin main
Step 5: Configure GitHub Pages
- Go to your repository on GitHub.
- Navigate to Settings > Pages.
- Under Source, select:
- Branch:
main(or your default branch). - Folder:
/ (root)if your rendered files are in the root directory, ordocs/if you’ve configured Quarto to save the site in adocsfolder.
- Branch:
- Save the settings. GitHub Pages will generate a public URL for your site.
- This might take some time, be patient! Once the green tick shows next to the commit message, then it is ready.
Step 6: Access Your Published Dashboard
- Visit the URL provided by GitHub Pages (usually
https://<username>.github.io/<repository-name>).
6.6 Further reading:
- Quarto dashboards
- Quarto dashboards video series
- Quarto dashboards with Shiny
- Mastering Shiny book by Wickham (2021)
- Shiny basics tutorial
- Dashboards: Using R to create actionable science
- UCSB Faculty Seminar Series: Grow Your Data & Team Science Skills: Quarto dashboards
- Happy Git and GitHub for the UseR book by Jenny Bryan (2025)
- Using Git and GitHub in RStudio cheatsheet
Key concepts for Shiny reactivity and interactivity
↩︎Aspect Reactivity Interactivity Definition Internal mechanism that updates outputs based on input changes. The user’s ability to interact with the app through inputs. Focus Logic and relationships between inputs, outputs, and expressions. The experience of manipulating and exploring the app. Example A plot updates automatically when an input changes. A user uses sliders, buttons, or checkboxes to customize the plot. Dependency Defined by reactive inputs and outputs. Enabled by UI elements (e.g., sliders, dropdowns). Free for smaller projects, otherwise has paid options. See an overview of deployment options here↩︎